Term Paper on Survey Signals: How Gender, Education, and Numeracy Shape Inflation Expectations (2015-2025)
 Snapshot of our findings
For the Tech2 term paper, Olav, Kai and I made a data-driven paper exploring how events, gender, education and numeracy shape expectations for inflation, stock prices and housing prices in the 10 year period (2015-2025) based on data from Survey of Consumer Expectations (SCE). Including how anchored the current inflation is in forming beliefs for expectations about the future across genders.
This post embeds the actual working notebook, so you can skim the highlights, copy individual cells, or download the full artifact.
Table of Contents
Project overview
- Goal: Look at correlations between gender and education and future expectations about macroeconomic trends.
- Tools: Python, pandas, NumPy, Matplotlib and glob.
- Outputs: Cleaned datasets, annotated code blocks, and executive-friendly figures pulled directly from the notebook outputs.
The notebook is structured as a narrative, moving from data ingestion to exploratory work, and finally into the polished presentation-ready charts. Each section contains the exact code we ran along with the inline conclusions that informed the written report.
Explore the notebook
tech2_term_paper_25
Python · Kernel: TECH2 · nbformat 4.5 · 71 cells
Part 1 · Reading in Survey Data
Import monthly SCE CSV files, harmonize column names, and report baseline sample statistics.
1.1
In this section we import the necessary Python packages, and read in all SCE files and combine them into a single DataFrame
| |
| |
1.2
The following is a report to understand the sample sizes of the Survey of Consumer Expectations (SCE)
| |
| |
========================================
        SCE Survey Data Summary
========================================
  Number of unique individuals: 23,369
 Total observations (rows):    176,101
   Number of survey waves:       139
The first date observed is:   2013-06-01
The last date observed is:    2024-12-31
========================================
Part 2 · Data pre-processing
Dropping/filling missing observations and creating additional variables
2.1
Filling in the missing numeracy variables according to the values from the first observation
| |
2.2
Dropping all observations with missing values for specific variables
| |
| |
| |
==================================================================
                   Dropped Observations Summary
==================================================================
 Dropped 868 observations (rows) due to missing demographic data.
Dropped 1,683 observations (rows) due to missing expectation data.
 Dropped 35,974 observations (rows) due to missing numeracy data.
------------------------------------------------------------------
                Total dropped observations: 38,525
              Remaining total observations: 137,576
==================================================================
2.3
Dropping outliers with implausible small or large values
| |
| |
==============================
   Dropped Outliers Summary
==============================
          inflation:
 Dropped 92 rows below -75.0%
 Dropped 27 rows above 100.0%
    Remaining rows: 137457
==============================
     house_price_change:
Dropped 133 rows below -50.0%
 Dropped 46 rows above 100.0%
    Remaining rows: 137278
==============================
       prob_stocks_up:
  Dropped 0 rows below 0.0%
 Dropped 0 rows above 100.0%
    Remaining rows: 137278
==============================
2.4
New column ‘college’ that equals 1 if the respondent has a bachelor’s degree or higher and 0 otherwise
| |
2.5
Summarizing the numeracy scores and defining new column ’num_lit_high’ for above-median performance.
| |
===================================
     Numerical Literacy Scores
===================================
 0.14% of individuals got 0 correct
 0.73% of individuals got 1 correct
 2.4% of individuals got 2 correct
 5.71% of individuals got 3 correct
10.51% of individuals got 4 correct
16.94% of individuals got 5 correct
27.41% of individuals got 6 correct
36.17% of individuals got 7 correct
===================================
2.6
The following is an updated report of the sample statistics for the Survey of Consumer Expectations (SCE)
| |
========================================
        SCE Survey Data Summary
========================================
  Number of unique individuals: 17,701
 Total observations (rows):    137,278
   Number of survey waves:       117
The first date observed is:   2015-04-02
The last date observed is:    2024-12-31
========================================
Part 3 · Average expectations by group
Analysing the three different variables gender, college and numeracy individually
| |
3.1
Computing the average expectations for inflation, house prices, stock market for each of the three variables
| |
| |
| |
3.2
Computing the average expectations for inflation, house prices, stock market for each of the three variables
| |
| |

| |

| |

Conclusion
Overall, the three bar charts reveal that groups who tend to be more financially informed or advantaged (men, college-educated, and high-numerical literacy) expect a lower inflation and increase for house prices but are more optimistic about stock market gains. Whereas women, lower education, and low-numeracy respondents expect a higher inflation and house price changes but show less confidence in the stock market.
Part 4 · Expectation dynamics by group
Investigating how average expectations evolved over time for the period of 2015-2024
4.1
Monthly averages grouped by gender, college degree and literacy regarding inflation, house prices, stock market
| |
| |
4.2
Figure that shows the monthly expectations of stocks increasing, changes in house prices, and inflation, differentiatet by gender, college, and numerical literacy.
| |
| |

Several geopolitical and economic events appear to have significant changes on monthly expectations with differances between male and female.
Trump’s first election (Nov 2016): Both genders recorded an almost equally sharp increase in the expected average probability of stock prices rising. Since the reaction was similar across genders, it likely reflects optimism about market performance driven by expectations of pro-business policies, such as tax cuts and deregulation. Because it likely was driven by macroeconomic sentiment, it also explains why there was an equal jump across genders.
Covid-19 outbreak (Feb 2020): The pandemic led to a significant decline in the expected average housing price change across both genders, correlating with uncertainty and declining economic activity. At the same time, both males and females exhibited an equally sharp increase in the average expected probability that stock prices would rise. To mitigate the risk of a long-lasting economic decline, governments and central banks created fiscal and monetary stimulus packages, which helped lower the risk premia and increased the expected returns on equity. Another contributing factor was lower interest rates to stimulate the economy, which made equity more attractive compared to safe assets. In addition, there was a greater decrease in average expected inflation by females than by males, suggesting stronger short-term deflation concerns.
Biden’s election: Around Biden’s election, male respondents exhibited a decline in the expected average probability of increasing stock prices, possibly due to expectations of tightened regulations. However, the graph does not change for females, suggesting lower sensitivity to political change.
Full-scale invasion of Ukraine: Both men and women expected rises in inflation after the Ukraine invasion, with women anticipating a large spike.
Trump’s second election: Female inflation expectations became more volatile. Whereas male expectations represented a more stable curve with a slight rise. Suggesting a different view on future polices.
Summary: In summary, female inflation expectations appear more volatile, possibly being more reactive to household price pressures, such as groceries and rent. Whereas men’s expectations seem more anchored and long-term. In regards of housing-price expectations, there is almost no changes across gender, besides males beeing generally more optimistic. The same goes for expected stock prices.
| |

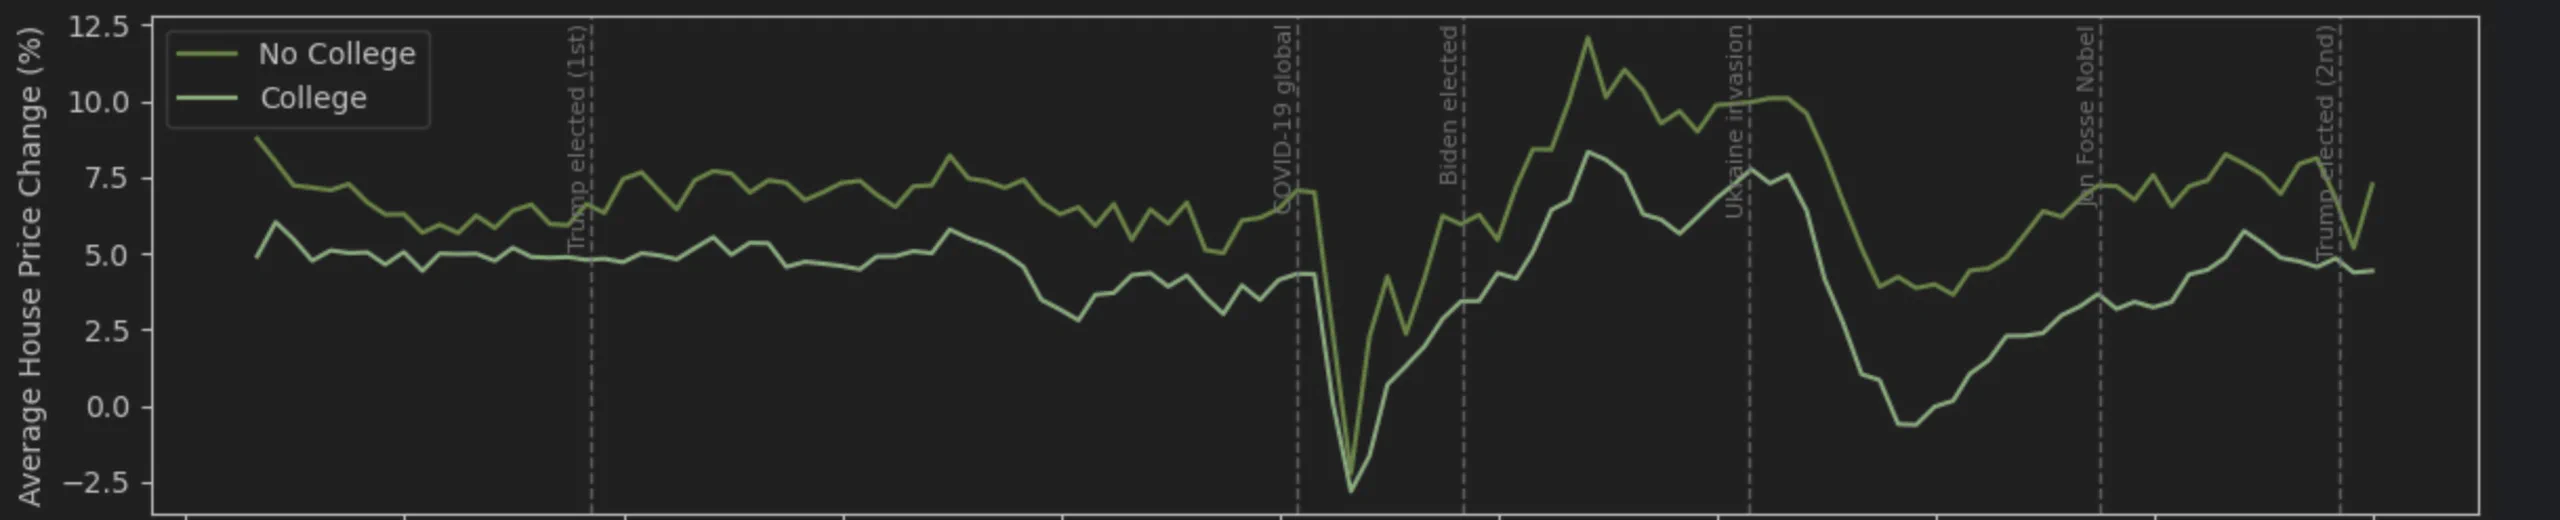
Geopolitical and economic events also shift monthly expectations for both college-educated and non-college groups.
Trump’s first election (Nov 2016): After Trump was elected, both groups expected a price increase in the stock-market. The reason for this can be interpreted in the same way as stated in the graph for Expectations by Gender. Although respondents with no bachelor’s degree showed a greater confidence, comperad to graduates. Respondents with no bachelor’s degree likely turned more optimistic about stocks after Trump’s win because they expected his pro-business agenda to boost industries and jobs they rely on, while college-educated respondents remained more cautious.
Covid-19 outbreak (Feb 2020): After COVID hit, both education groups reacted similar to the Expectations by Gender graph and reflects the same reasoning. They also expected a sharp drop in house prices, converging on almost the same decline. Later though the respondents with no bachelor’s degree peeled away and expected a larger increase in house prices unlike graduates. Expected inflation also diverged sharply. Graduates stayed roughly level, while non-graduates expected a much higher inflation once COVID’s impact became clear. This split, both for house prices and inflation, reflects tight supply and stimulus-fueled demand in the starter-home market.
Biden’s election: As the Democrats got back into office, expected growth for stocks and changes in house prices moved almost in parallel for both groups. Inflation expectations rose for both groups, yet non-graduates were noticeably more concerned with a higher inflation.
Full scale invasion of Ukraine: Similar to male and female expectations, both groups anticipate a rising inflation after the invasion and non-graduates expect a much higher inflation overall.
Trump’s second election: Expected inflation grew after Trump regained his presidency. Graduates expected this earlier than non-graduates.
Summary: Geopolitical shocks kept reshaping expectations, reset expectations for both education groups, but non-graduates swung harder. They embraced Trump’s pro-business agenda, braced more for inflation through COVID and Biden’s victory, and reacted more sharply to the Ukraine invasion and Trump’s return, while graduates stayed steadier.
| |

There are also Geopolitical and economic events that shift monthly expectations for both higher numerical literacy and below-median numerical literacy groups.
Although these fluctuations can be compared with the fluctuations within the Education level. The similarity likely comes from the strong overlap between the two groups. Many college graduates also fall into the high-numeracy category. As a result, changes linked to education tend to move the numeracy groups in the same direction.
For stocks, the numeracy gap widens more: High-numeracy respondents are generally more optimistic in their expectations than low-numeracy, even when the college gap shrinks. This indicates that high numeracy boosts confidence in stocks beyond what education alone explains.
Part 5
Compare monthly SCE inflation expectations with realized CPI inflation. Looking forward 12 months and backward 12 months to assess whether expectations anticipate future outcomes or if they are anchored in recent experience.
5.1 Realized future inflation
Compare the expectations to realized future inflation
| |
5.1.1 Compute realized inflation
Using this monthly CPI data, computing the annual realized inflation over the next 12 months for each month
| |
| |
5.1.2 Merge Expected Inflation with Realized Inflation
Merge the gender-level expected inflation series with the CPI-based realized inflation so each month has both numbers side by side.
| |
5.1.3 Scatter Plot and Correlation
Ploting male and female expectations against realized forward inflation, and displaing each panel’s correlation so we can judge how correlated they are
| |
| |

5.2 Merge with past realized inflation and compare correlations
Repeat steps from 5.1, but with past realized inflation
| |

Evaluation of the scatter plots:
What the correlations show:
Forward-looking correlations (ρ=0.54 for men, 0.58 for women) are only moderate, whereas the backward-looking correlations increase to 0.80 and 0.82. This shows that future expectations are significantly anchored in recent inflation rather than accurately anticipating future inflation. In other words, instead of anticipating future inflation rationally, one instead extrapolates from past trends, adaptive rather than rational behaviour.
Gender comparison:
In both forward- and backward-looking correlations, the gender gap is negligible, supporting the idea of information sharing being equal among genders influenced by news, prices, etc. As discussed earlier, women tend to expect slightly higher inflation on average; however, the difference in correlation between expectations and realized inflation is insignificant. The male data hugs the 45° line (correlation line) a bit more closely, so their expectations sit nearer to realized forward inflation, though not a strong correlation. Both males and females are generally too pessimistic when predicting future inflation (they “fear” more inflation than what actually occurs) and therefore bias upwards to realized inflation.
Summary:
Overall, both groups exhibit adaptive expectations, and neither gender stands out as a significantly better forecaster. This indicates a general pessimistic bias in their inflation expectations.
AI statement and sources:
This term paper was written and coded by the group members. AI helped polish wording, formatting docstrings, comments and looking over the final product. We used the lectures and workshops in tech2 as sources.
The outputs have been preserved so you can trace the intermediate calculations that shaped the final results.
Key takeaways
Demographics drive expectation bias
Men, college‑educated respondents, and high‑numeracy households consistently expect lower inflation, milder housing gains, and stronger equity performance. Women, non‑college, and low‑numeracy groups price in higher inflation and house-price growth but remain skeptical about stocks. Numeracy amplifies optimism even within the same education tier.Macro shocks move all groups—but unequally.
US elections, COVID-19, and the Ukraine invasion triggered sharp shifts in inflation, housing, and equity expectations across every demographic, yet less-educated and low-numeracy respondents “swing” farther—especially on inflation—while college/high-numeracy cohorts stay steadier. Gender differences surface mainly in volatility (women react more to household-price pressures).Expectations are adaptive, not predictive
Forward-looking correlations between expected and realized inflation are only moderate (≈0.55 for both genders), while backward-looking correlations exceed 0.80. Both genders extrapolate recent inflation rather than anticipate future moves, tending toward pessimistic bias; neither group is significantly better at forecasting.